Mexico, China and India lead global SHIP market
April 25, 2019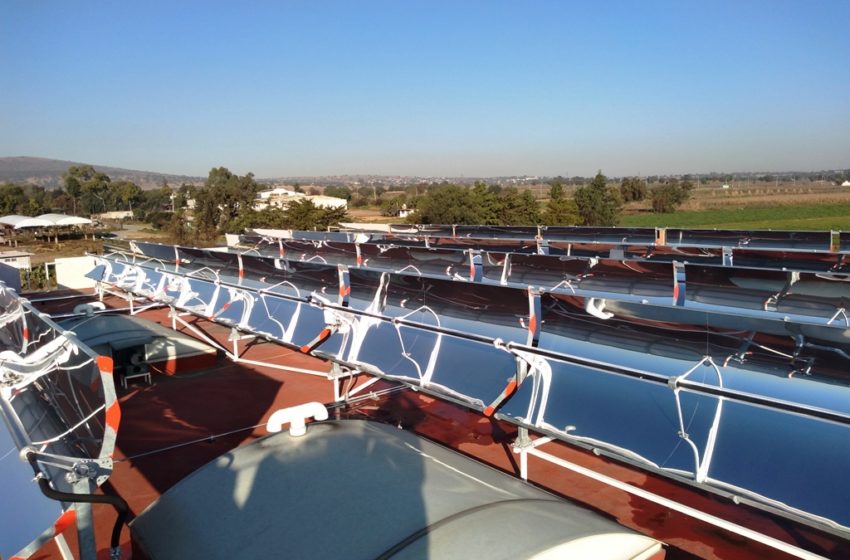
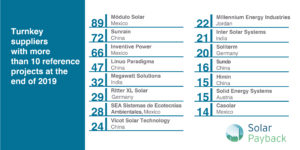
In 2018, suppliers of industrial solar heat technology commissioned 104 systems with a combined collector area of at least 57,283 m² (40 MWth). The number of systems was nearly identical to that a year earlier, when 107 installations came online. At the end of last year, at least 736 SHIP plants were up and running in all corners of the globe, a 16 % increase compared to 2017, when 632 were in operation worldwide. These are some of the findings from surveying turnkey solutions providers listed on the SHIP Supplier World Map, which was created by the international project Solar Payback. However, regardless of their location, 93 % of those offering systems to provide Solar Heat for Industrial Processes said, in a repeat of the situation in 2017, that they were not satisfied with business growth. Of the 82 participating companies only 32 installed one SHIP system or more last year. The text boxes describing each company on the world map will be updated in the coming weeks.
Photo: Inventive Power
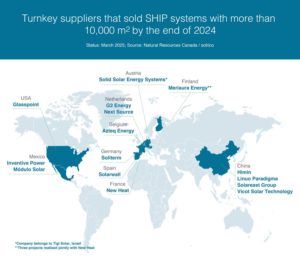
SHIP is global business. Based on the number of systems, the leading markets in 2018 were Mexico (51), China (15), India (10) and Germany (9). But industrial solar heat systems were also installed in Argentina, Austria, Cyprus, France, Greece, Israel, Italy, South Korea, South Africa, Spain, Turkey, the UAE and the USA.
The SHIP capacity added last year was much smaller (40 MWth) than a year earlier (134 MWth) because US-based project developer Glasspoint postponed the commissioning of additional parabolic trough collector arrays, which it had intended to install in greenhouses at the solar steam plant near the Aman West oilfield in Oman. In 2017, Glasspoint brought online the first 4 units with 100 MWth of capacity and announced another 200 MWth to be put up later in 2018. This 200 MWth-target was now postponed to 2019.
The largest market based on the number of systems, Mexico, added 51 in 2018 and greatly surpassed its 2017 total of 36. Technology suppliers expect the market to grow in 2019 as well, a prediction that is based on their positive experiences with industrial solar solutions and their trust in the technology, as the country offers no direct SHIP investment subsidies. Still, they were less than satisfied with how many sales contracts they concluded in 2018 when compared to the enormous national potential of SHIP. The reason: They have a hard time competing in a country that offers low gas prices and where financing is not available. “Mexico’s SHIP market has promise, but the need for upfront investments and a lack of loan schemes lowers the chance of successful project negotiations,” said one Mexican-based technology supplier.
| No. of systems put up in 2018 | Collector area added in 2018 [m2] | Average system size [m2] | |
| Mexico |
51 |
6,898 |
135 |
| China |
15 |
28,813 |
1,921 |
| India |
10 |
3,964 |
396 |
| Germany |
9 |
1,589 |
177 |
| Spain |
3 |
1,218 |
406 |
| France |
2 |
5,543 |
2,772 |
Table 1: Number and size of solar SHIP plants put up in key countries
Source: Solar Payback SHIP Supplier Survey 2018
The Chinese SHIP market is most probably much larger than the surveys indicate. For example, Linuo Paradigma confirmed that most plants in China are installed by local engineering companies that buy collectors from large manufacturers. Data on well-known solar brands participating in the survey did not include these types of locally planned and implemented SHIP projects. One of the centres of new and large commercial SHIP installations is Shandong province, thanks to a long-term support scheme known as Solar+. In March 2018, the province’s industry and finance departments published a list of all applications submitted for solar space heating and process heat under the programme. This list included 146 solar thermal systems, with 34 to be used for supplying heat in industry. Unfortunately, the provincial government did not say how many of them had been commissioned successfully last year, which is why they were not considered in the SHIP world market 2018.
|
2017 |
End-of-year |
2018 |
End-of-year |
|
| No. of commissioned SHIP systems |
107 |
632 |
104 |
736 |
| Minimum of newly installed collector area [m²] |
190,708 |
n/a |
57,283 |
n/a |
Table 2: Analysis of the global SHIP market in 2017 and 2018. The figures for 2017 had to be updated, as three projects were postponed until 2018.
Source: Solar Payback SHIP Supplier Survey 2017 und 2018
|
SHIP collector area installed in 2018 [m²] |
Percentage of total collector area |
|
| Vacuum tube |
31,563 |
56% |
| Parabolic trough |
11,414 |
20% |
| Flat plate |
11,096 |
18% |
| Dish |
2,775 |
5% |
| Linear Fresnel |
360 |
1% |
| Total |
57,208 |
SHIP installations in 2018, broken down by type of collector
Source: Solar Payback SHIP Supplier Survey 2018
As in the previous year, vacuum tube collectors were the main SHIP collector technology. The most popular sort of solar concentrating technology was parabolic trough, used successfully in SHIP plants in 2018 by 11 manufacturers in total. Solar dishes were installed by only two companies, both based in India, while two smaller systems had reportedly been equipped with Linear Fresnel collectors.
The SHIP supplier survey was carried out by German-based consultancy solrico, in collaboration with some of its global network partners, namely Silke Funke and Marisol Oropeza, Germany, and Jaideep Malaviya, India. The findings of the 2017 SHIP supplier survey are available here.
Organisations mentioned in this article: