
“Racing down the renewable electricity pathway only”
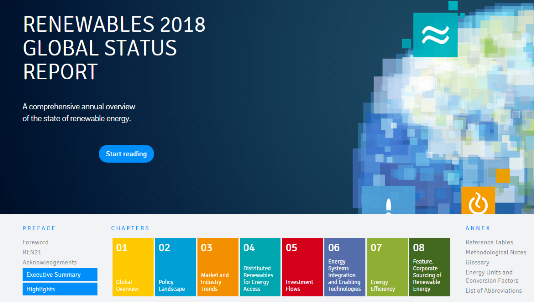
 The Renewables 2018 Global Status Report illustrates the sharp difference in growth between the renewable electricity and heat markets. Whereas PV had another record year, with newly installed capacity totalling at least 98 GWp in 2017, up from 75 GWp, and wind its third-best ever, by adding 52 GW, solar heating and cooling increased by only 35 GWth – a 4 % drop compared to 2016. “Transformation is picking up speed in the electric power sector, but urgent action is required in heating, cooling and transport,” was the key message of a press release published by Paris-based REN21. The report, launched at the beginning of June, has been followed by a series of speeches at events in Manila, Paris, Brussels, Moscow, Washington and New York. The press release, translated into 12 languages, has been picked up by media outlets around the globe.
 Another stark contrast between electricity and heat has been the number of policies implemented for each: Renewable heating and cooling targets have been set by no more than 48 countries, while 146 have ones for green electricity. “Equating electricity with energy is leading to complacency,” Rana Adib, Executive Secretary of REN21, is quoted as saying in the press release. “We may be racing down the pathway towards a 100 % renewable electricity future. But when it comes to heating, cooling and transport, we are coasting along as if we had all the time in the world. Sadly, we don’t.”

|
Technology |
Capacity added in 2017 |
Capacity added in 2016 |
Top five countries based on new additions in 2017 |
|
Solar heating and cooling |
35 GWth |
36.5 GWth |
China, Turkey, India, Brazil, USA |
|
Photovoltaics |
98 GWp |
75 GWp |
China, USA, India, Japan, Turkey |
|
Wind |
52 GW |
55 GW |
China, USA, Germany, UK, India |
|
Concentrating solar power |
100 MW (1 plant) |
110 MW |
South Africa |
|
Geothermal |
0.7 GW |
0.4 GW |
Indonesia, Turkey, Chile, Iceland, Honduras |
|
Hydropower |
19 GW |
25 GW |
China, Brazil, India, Angola, Turkey |
Data taken from the market and technology sections in chapter 3 of the GSR 2018.

Glazed and unglazed collectors added nationally. Last year, the top 20 countries accounted for an estimated 93 % of new solar thermal installations around the world. Table R20 on page 211 shows the numbers relating to this chart.
Source: Global Status Report 2018
The chart above shows the development of the 20 largest solar heating and cooling markets in 2017, with sales growing in Greece, India, Mexico and Turkey, which have no national support schemes but cost-competitive solutions. Their situation is opposite to that of countries such as Germany and Italy, which heavily subsidise solar thermal but whose markets continue to trend downwards, declining by 16 % and 4 % respectively.
In Germany, still the largest market in Europe, the decline was caused by plummeting sales of combi systems. By contrast, 2017 saw record demand for heat pumps used in space heating, with their easy installation appealing to installers and end consumers alike.
Most leading countries defended their positions in the ranking, except Denmark, which disappeared from the list (9th place in 2016) and made room for Tunisia. 2017 saw just two smaller solar district heating plants being built and three systems expanded, with new capacity in the northern European country amounting to as little as 19.7 MW, or 26,636 m². The reason for the significant decline was that project development requires several years of planning. Endeavours post-2016 have been stalled because the new energy savings regulations for utilities were signed only at the end of 2016. Consequently, several new projects were started in 2017, but most could not be completed by year end.
Last, here are some encouraging developments described in the GSR 2018, although most are about renewable electricity:
- A record number of new industrial solar heat systems came online in 2017.
- The number of cities where renewable electricity accounted for at least 70 % of the total more than doubled between 2015 and 2017.
- Apart from traditional biomass use, renewables met 10.3 % of global heat demand in 2017.
- An estimated 17 countries generated more than 90 % of their electricity last year by using renewable sources of energy.
- 85 countries, states or provinces have renewable electricity targets above 50 %.
- In 2017, China added more solar PV capacity than the world had installed in 2015.
- 2017 was also a landmark year for CSP, based on the tariffs offered as part of competitive tenders.
You can download the report at http://www.ren21.net/status-of-renewables/global-status-report
Recommended solar heating and cooling chapters and sections:
Solar Heating and Cooling Market and Industry (pp. 103 to 108)
Table R20. Solar Water Heating Collectors and Total Capacity End-2016 and Newly Installed Capacity 2017, Top 20 Countries (p. 211)
Global Overview: Heating and Cooling (pp. 35 to 37)
Policy Landscape: Heating and Cooling (pp. 54 to 55)